Enterprise Monitoring
Full-stack monitoring for infrastructure, network, apps, containers, and services — with alerting, dashboards, auto-discovery, and reporting at enterprise platforms like Zabbix.
Shabake Gostar Kayer designs and delivers end-to-end enterprise monitoring: from agents and SNMP to distributed proxies, triggers and escalations, operational dashboards, topology maps, web/API checks, databases, VMware, Kubernetes, logs, and SLA reporting. The goal is real-time visibility, lower MTTD/MTTR, and centralized operations at enterprise scale.
Capabilities
- Metrics via Agent, SNMP, IPMI, JMX, and HTTP
- Server, network, cloud, and container monitoring
- Auto-discovery and reusable templates
- Triggers, problem detection, and escalations
- Email, SMS, chat, and webhook notifications
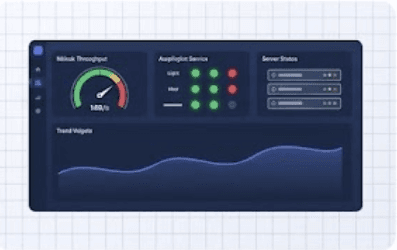
- Dashboards, graphs, maps, and SLA reports
Data Collection & Protocols
Multiple collection methods to cover the full IT asset landscape.
- Agent-based monitoring for Linux and Windows
- SNMP v1/v2c/v3 for network and hardware
- IPMI for server hardware health
- JMX for Java applications
- HTTP/HTTPS checks and web scenarios
- ODBC / database checks
- Custom scripts and external checks
- Trap and event-based collection
Infrastructure & Service Monitoring
Coverage across compute, network, storage, virtualization, and containers.
- CPU, memory, disk, filesystem, and process health
- Switch, router, firewall, and link monitoring
- System services and port availability
- VMware / hypervisor monitoring
- Docker and Kubernetes (pod, node, deployment)
- Database monitoring (PostgreSQL, MySQL, Oracle, ...)
- Application and middleware monitoring
- Cloud and hybrid infrastructure visibility
Auto-discovery, Templates & Inventory
Reduce manual work with discovery, reusable templates, and asset inventory.
- Network discovery and low-level discovery (LLD)
- Ready templates for OS, DB, network, and apps
- Template inheritance and overrides
- Hardware and software inventory
- Host tagging and grouping
- Bulk onboarding of new assets
Alerting, Escalation & Incidents
From problem detection to multi-step escalation for NOC and operations teams.
- Advanced triggers and thresholds
- Problem / event / recovery tracking
- Time- and severity-based multi-step escalations
- Notifications: email, SMS, Telegram, Slack, webhooks
- Maintenance windows and suppression
- Correlation to reduce alert noise
- Help desk and ITSM integration
Dashboards, Maps, Reports & SLA
Operational views for teams and management reporting for decisions.
- Custom widget-based dashboards
- Historical and real-time graphs
- Network maps and topology views
- Availability and performance reports
- SLA / SLO reporting
- Export and scheduled reports
- NOC wallboard views
Scalable Architecture & Security
Built for large organizations with proxies, HA, and access control.
- Distributed monitoring with proxies
- High availability for server and database
- RBAC and audit logging
- Encrypted agent and proxy communications
- API for automation and integrations
- Monitoring backup, restore, and DR
- Capacity planning and trend analysis
Synthetic Monitoring & User Experience
Verify service availability from the end-user perspective.
- Web scenarios and step-based checks
- Critical API and endpoint monitoring
- Latency and availability measurement
- Certificate expiry monitoring
- DNS and mail service checks
- Synthetic probes from multiple locations